Skip to content
Features

A serious planner. Private by design.

Everything teams expect from high-end Gantt chart software, plus an AI assistant that does the work, running entirely on your own machine.

Interactive Gantt timeline

A fast, drag-and-drop timeline that schedules the way real work does.

  • Drag to reschedule, resize to re-estimate, working-day aware
  • Parent tasks roll up their children's dates automatically
  • Day, week and month zoom, with a mini-map to navigate big plans
  • Unscheduled tasks stay visible as placeholders, never lost
  • Undo 100 steps deep, with a history panel that jumps back anywhere
  • Light theme or dark, per person, or following the system

Built-in AI assistant, 39 tools

A real assistant that edits your actual chart, on your own API key.

  • Plan a project, draft tasks, or restructure from a sentence
  • Level overloaded people and surface schedule risks
  • Simulate a slip with What-if, get a Monday brief, chase overdue statuses
  • Time Machine replays what changed since any date; War Room fixes an overloaded person across every project
  • The forecasts are computed, not written by a language model. It phrases the maths, it does not invent it
  • Bring your own provider and key, point it at a local model
  • Prompt templates and @ / # / > mentions for tasks and people

Dependencies & critical path

Link work, keep the gaps you set, and see what actually drives the deadline.

  • Finish-to-start and the other three dependency types, with lag
  • Moves cascade through the schedule and preserve per-edge gaps
  • Critical Path Mode lights up the chain that sets your end date
  • Conflicts are detected and flagged, not silently absorbed

Allocation & overload

See who is overbooked before it becomes a missed deadline.

  • Per-assignee workload as a percentage, with an over-100% badge
  • On-bar allocation bands and hatched conflict segments
  • Group the timeline by assignee for a resource view
  • One click from an overload to an AI leveling suggestion

Workload heatmap

Team capacity at a glance: people down, weeks across, load as color.

  • Per-person capacity across all projects, by day, week or month
  • Over / full / under / free filters find spare room in seconds
  • Click a hot cell to see the tasks driving the peak, and locate them on the Gantt

Baselines & variance

Snapshot the plan, then measure reality against it.

  • Capture a baseline at any moment
  • Track drift with a variance KPI as work moves
  • Restore from a baseline when reality diverges

Executive Magic Overview

The whole project as a one-page story for the steering meeting.

  • KPI strip, milestones, phases and critical path on one screen
  • Presentation mode for walking a room through the plan
  • Exports to native PowerPoint and Excel

3D Timeline Show

Fly through your plan in a cinematic 3D scene.

  • An exact 3D mirror of the chart: glass timeline, gem milestones
  • Dependencies glow as flowing lines between bars
  • Walk the plan with scroll, or let the camera glide

Dashboard & My Tasks

Analytics that answer back for the manager, a command center for everyone else.

  • Deadline forecast: on track, or "will miss by 7 days", with the reasons why
  • This week's brief: ranked risks, one click jumps to the offending task
  • Six-week resource heatmap and true cross-project workload bars
  • Click any stat or chart to open exactly those tasks on the Gantt
  • My Tasks: list, kanban board and calendar views, iCal export, natural-language quick-add
  • Saved views, a Today focus flag, and a My Week strip that plans your day

Import & export anywhere

Hand the plan to any room in the format it expects, or bring one in.

  • Excel (.xlsx) with a colored-cell Gantt view, CSV, and lossless JSON
  • MS Project (.xml) and MS Planner, both directions, no Java required
  • Native PowerPoint and a vector PDF report
  • Import into a new project or merge into an existing one

Portfolio across projects

Every project on one page, for the person who has to answer for all of them.

  • List, table or Portfolio Timeline, projects side by side as bars so the overlaps show
  • Health score per project, and the badge explains what dragged it down
  • Cross-project workload: one person's load is the sum of everything they are on
  • Save any plan as a template and start the next project from the gallery
  • Archive, duplicate, favourite, and post a status update without leaving the page

Team, roles and capacity

Who is on the team, what they can touch, and when they are actually available.

  • Manager, member and a read-only viewer role, each scoped to their own team
  • Contractors are name-only: assignable to tasks, no login to create
  • Squads group people inside a team, so a big roster stays readable
  • Time off feeds straight into capacity, so leave shows up as reduced load
  • Per-person job title and a four-week load sparkline on the roster

Collaboration, two ways

Live on a server you host, or by passing a file around. Both are real.

  • Team server edition: everyone on the LAN sees changes as they happen
  • Desktop editions: share a copy with a member, merge the one they send back
  • The merge is a real 3-way review: their own-task edits apply, everything else you approve field by field
  • Task comments with @mentions across both
  • An in-app notification inbox, email alerts and a weekly brief digest

Local-first & private

All of the above, running on your machine, not someone else's cloud.

  • Your projects live in a file you control; works fully offline
  • No telemetry, no phone-home, integrity-verified builds (checked at boot)
  • Offline, public-key license check, no activation call to us

Your theme, not ours.

The same plan, the same day, in both. Each person picks their own, or follows whatever the machine is set to.
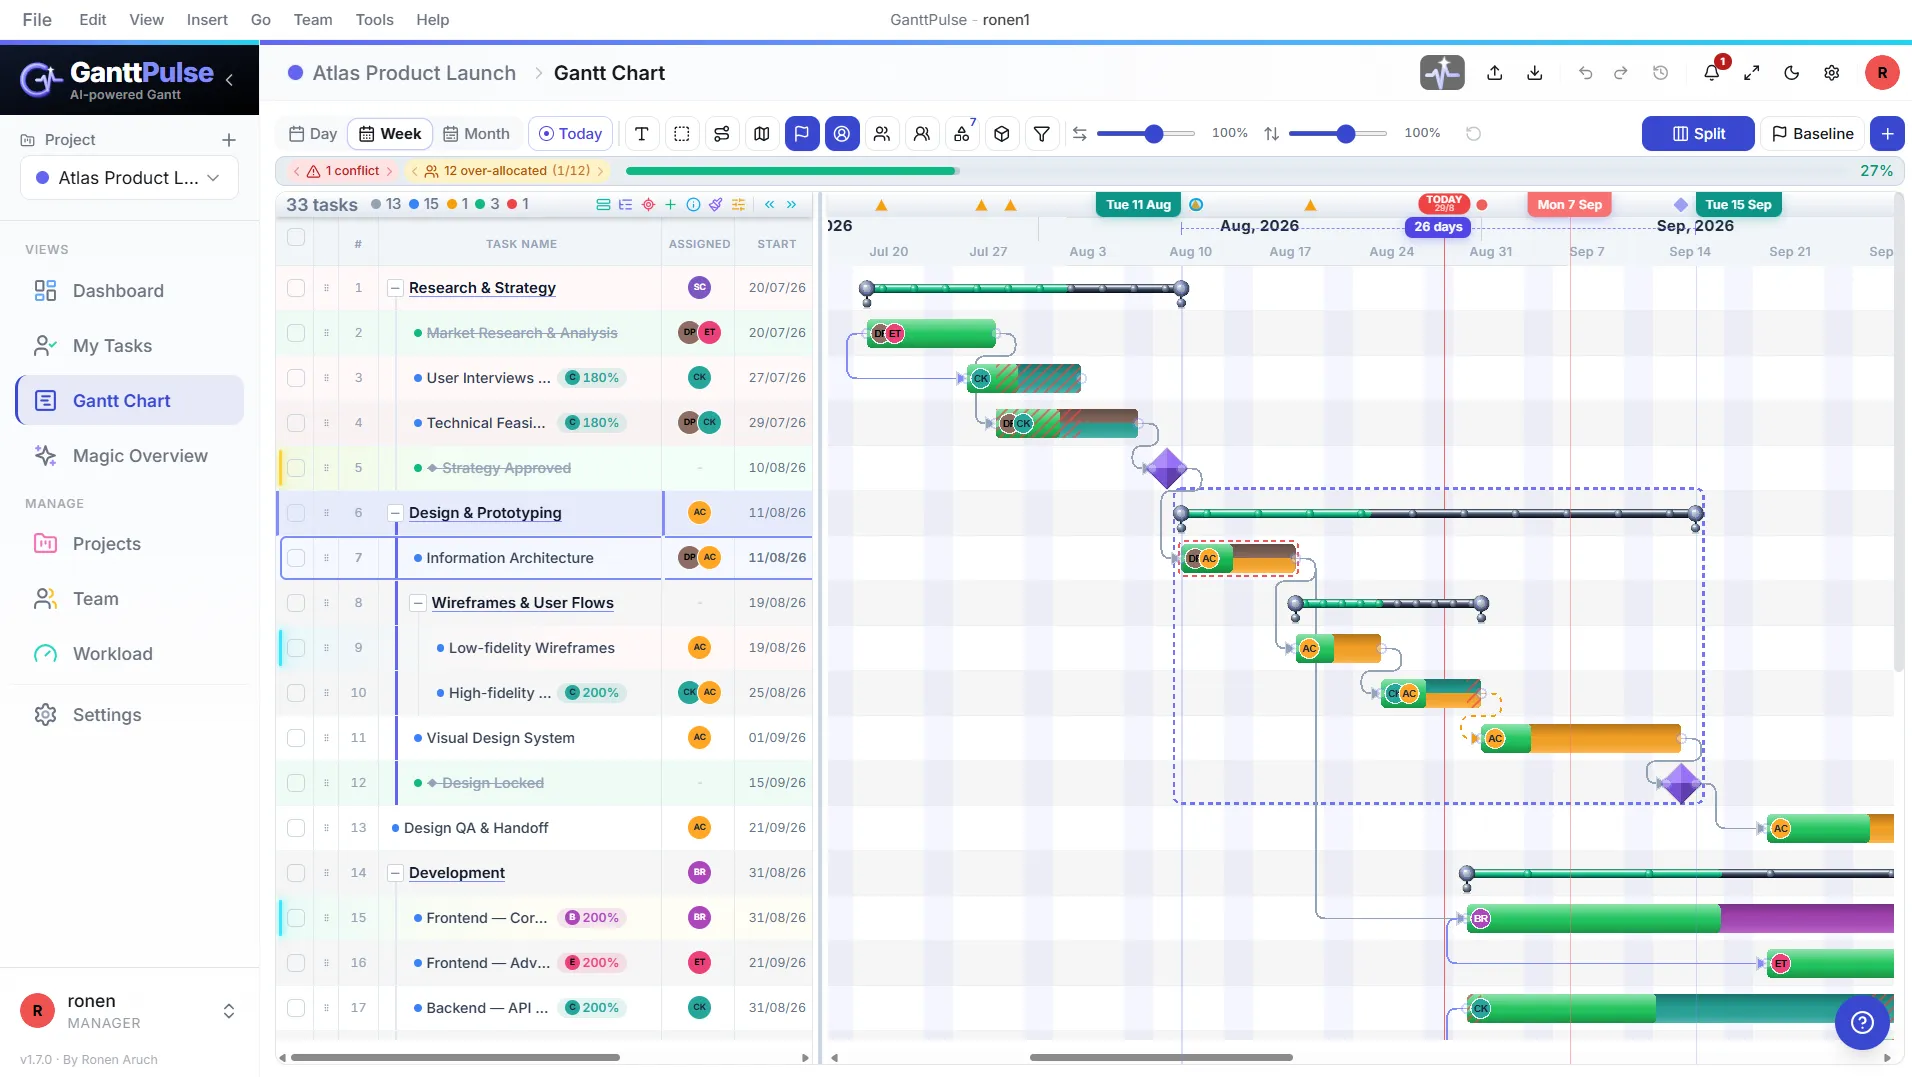
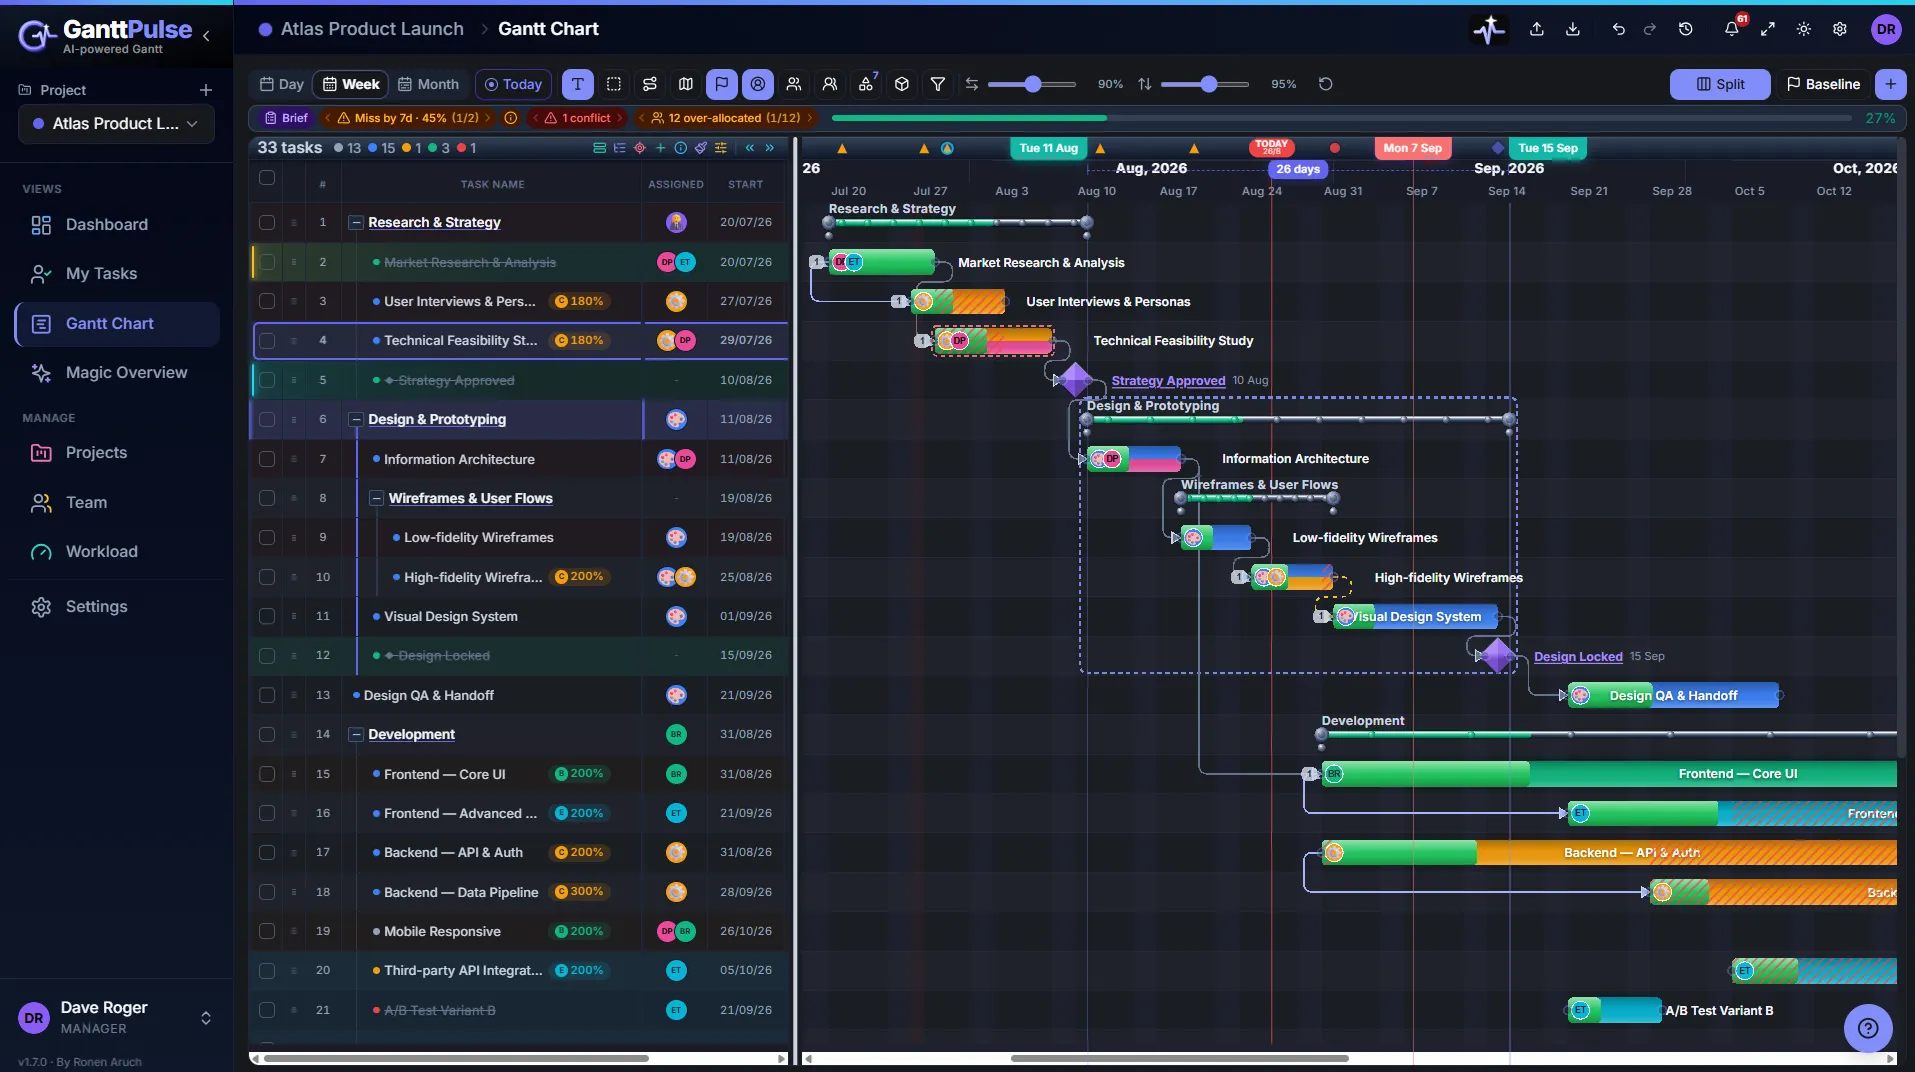
The GanttPulse Gantt chart in the light theme The same chart in the dark theme
Set per person in Settings, or left to follow the machine. The switch retints every screen below it too.

Straight from the app

Not a concept, the real thing

These are GanttPulse's actual views, rebuilt from the real app, not mockups. And the real thing moves: watch the AI build a plan and tour every feature on it.

Dashboard

Portfolio health at a glance, status mix, completion trend, priority load, and exactly who's overbooked this week. It forecasts the deadline ("on track" or "will miss by 7 days", with reasons) and every stat clicks through to those tasks on the Gantt.

Atlas 2026 Dashboard
SB
94 Health

Good evening, Dave

Atlas Product Launch · 26 Aug 2026

At risk: 4 tasks overdue (12% complete overall).

4 overdue 1 on hold 1 unscheduled

Recommended: Reschedule or reassign the 4 overdue tasks.

Refresh
94% Health
27 Total
3 Done
11 Active
4 Overdue
1 Unscheduled
This Week's Brief
  • Your Dec 7 deadline is now Dec 14, 7 days late

    "Design & Prototyping" slipped 1 working day, the biggest driver.

  • "Design & Prototyping" slipped 1 working day vs baseline

    5 tasks are behind the baseline plan.

Project Timeline
20/07/26 → 14/12/26 147d total
Time: 26% Done: 27%
Status Breakdown
Not Started 11
In Progress 11
On Hold 1
Completed 3
Cancelled 1
Completion Trend
1W 1M 1Q
30 days agoToday
Priority Distribution
Critical
4
High
12
Medium
17
Low
5

My Tasks

Each person's own queue, due-soon, overdue, and progress, grouped the way they actually think about their work, in list, kanban board or calendar view, with natural-language quick-add.

Atlas 2026 My Tasks
SB

My Tasks

24 Total
11 Active
4 Due Soon
2 Overdue
8 Completed
New Task Due Date No Grouping Filters
D Me
+ Save view
My week · 26 Aug-1 Sep
W T F S S M T
Workload → Plan my day

Atlas Product

4 tasks 3 2
#
Name
Status
Priority
Assignees
Work %
Owner
End
1
- Development
In Prog
High
BR
100
B Bob Rivera
10/12/26
2
Frontend Core UI 300%
In Prog
High
BR
100
B Bob Rivera
24/11/26
3
Mobile Responsive 200%
Not Started
Med
BR
100
R Ronen
10/12/26
--
- Quality & Testing
Not Started
High
AC
R Ronen
10/12/26
4
Integration Testing 200%
Not Started
High
AC
100
R Ronen
06/12/26

Mobile App

3 tasks 2 1
#
Name
Status
Priority
Assignees
Work %
Owner
End
5
- Release 2.4
In Prog
Critical
DK
100
D Dana Kim
18/12/26
6
Offline sync 150%
In Prog
High
DK
100
D Dana Kim
02/12/26
7
Push notifications
On Hold
Med
AC
50
R Ronen
20/12/26

Team

Your workspace and its people: roles, task counts, and live workload bars, all scoped to the team you manage.

Atlas 2026 Team
SB

Team

6 members · 1 contractor

Export Add Member
Search by name, email, or job title...
All Members
Teams 1 + New team
A Team
Managers 1 + Add manager
Member ↑ Tasks Workload Actions
R

Ronen (You)

2
100%
Manager
Members 5 + Add member
Member ↑ Tasks Workload Actions
AC

Alice Chen

alice@demo.com

11
300%
Member
A

alon

6
200%
Member
BR

Bob Rivera

bob@demo.com

8
300%
Member
CK

Charlie Kim

charlie@demo.com

11
400%
Member
ET

Evan Torres

evan@demo.com

6
200%
Member
Contractors 1 + Add contractor
Member ↑ Tasks Workload Actions
DG

Dave Gal

0
0%
Contractor
Viewers 1 + Add viewer
Member ↑ Tasks Workload Actions
VV

Vera Viewer

viewer@demo.com

0
0%
Viewer

Workload

The team capacity heatmap: people as rows, weeks as columns, each cell a person's peak load against their own capacity. Overloads glow red, and one click hands them to the AI to level.

Workspace Workload
SB

Workload

Peak load per week across all projects, judged against each person's own capacity.

All (6)Over (3)Full (1)Under (2)Free (0)
DayWeekMonth
Working days Today
Person
Jun 29
Jul 6
Jul 13
Jul 20
Jul 27
Aug 3
Aug 10
Aug 17
A

Alice Ben

peak 110%

Level this overload with AI
95%
80%
110%
100%
70%
60%
85%
75%
B

Bob Rivera

peak 145%

Level this overload with AI
120%
145%
130%
110%
90%
75%
100%
95%
C

Charlie Kim

peak 160%

Level this overload with AI
100%
130%
160%
150%
120%
90%
80%
70%
D

Dave Roger

peak 70%

·
·
·
·
·
45%
60%
70%
D

Diana Petrov

peak 100%

80%
90%
100%
95%
·
60%
85%
90%
E

Evan Torres

peak 80%

60%
75%
80%
65%
70%
55%
·
·

Charlie Kim

Jul 13 – Jul 19 · peak 160% of 100% capacity

Backend - API & Auth

60% · Jul 6 – Jul 24 · Atlas Product Launch

Backend - Data Pipeline

60% · Jul 13 – Jul 31 · Atlas Product Launch

Performance & Load Testing

40% · Jul 13 – Jul 22 · Mobile App v2

Projects

Every project with a health score, done and overdue counts, and a progress bar, the portfolio view for managers.

Workspace Projects
SB

Projects

4 active projects across your team

New from template New Project
Atlas 2026 Current 86 On track
64% complete 8/24 tasks
02 Mar 2026 → 18 Dec 2026
SB 3h ago 111d left
Design sign-off · 12 Sep
Mobile App v2 24 10 overdue
18% complete 2/42 tasks
12 Jan 2026 → 30 Sep 2026
BR 2d ago 32d left
Beta cut · 04 Sep
10 overduebehind by 46%
Website Redesign 78 On track
71% complete 10/16 tasks
05 May 2026 → 20 Nov 2026
AC 5h ago 83d left
Content freeze · 18 Sep
Q3 Marketing 52 3 overdue
40% complete 4/11 tasks
01 Jul 2026 → 30 Sep 2026
DK 1d ago 32d left
Campaign live · 08 Sep
3 overdue2 on hold

See it on your own machine

The whole toolkit, your data, no cloud. Privacy isn't a setting, it's the architecture.